One problem we hear about often is a lack of effective reporting. Google’s Looker Studio is an accessible, free tool that can help you get a leg up on content performance reporting. That’s where our dashboard template comes in: this Looker Studio dashboard that we created is easy to replicate and shows you exactly how your projects, landing pages, and channels are performing over time.
Why is a dashboard like this one important?
Well, if you’re allocating time and resources to marketing and optimization, it’s crucial that you’re able to show how that content is performing for you. How else will you be able to understand what’s working and what’s not? Understanding what content efforts are winning and losing is the key to knowing what to do more of, what to do less of, and what to improve. So, let’s get started on creating your business’s content performance dashboard.
What you need before you start:
- Active GA4 account + login credentials
- Records of pages created or optimized in SEO efforts, along with decisions about how to categorize each one by Project and Page Type
How to Create Your Own Content Performance Dashboard
1. Make a copy of the JCT Growth Content Performance Dashboard in Google’s Looker Studio
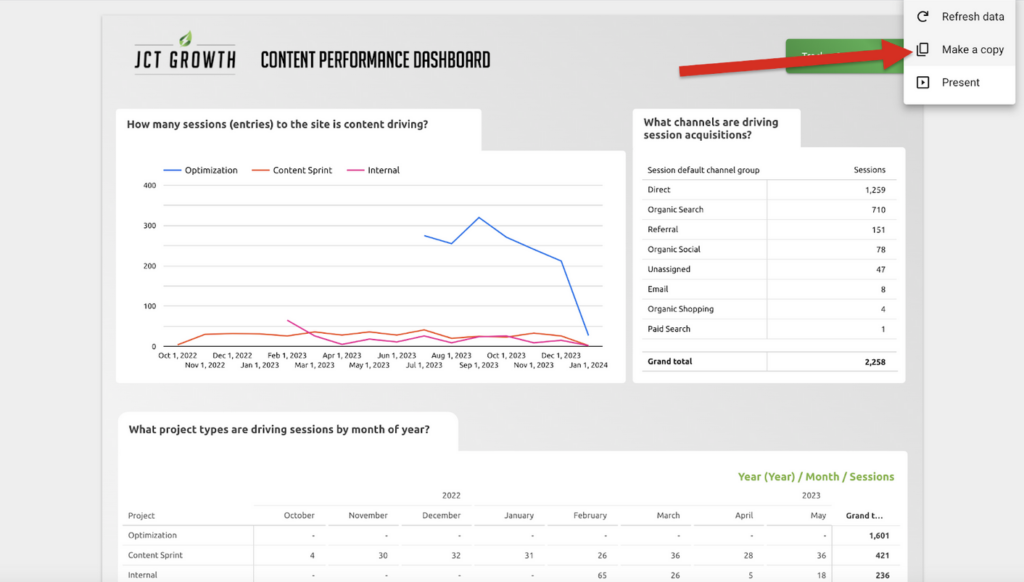
- Make sure you are logged in on your browser from the Google account you use to access GA4Looker Studio Content Performance Dashboard
- Click the three dots in the upper right corner of the report and select “Make a Copy”
- The window will prompt you to choose new data sources – don’t worry about editing this quite yet, just select “Copy Report.”
- Rename the copied report something like “[Your Business Name] Content Performance Dashboard.”
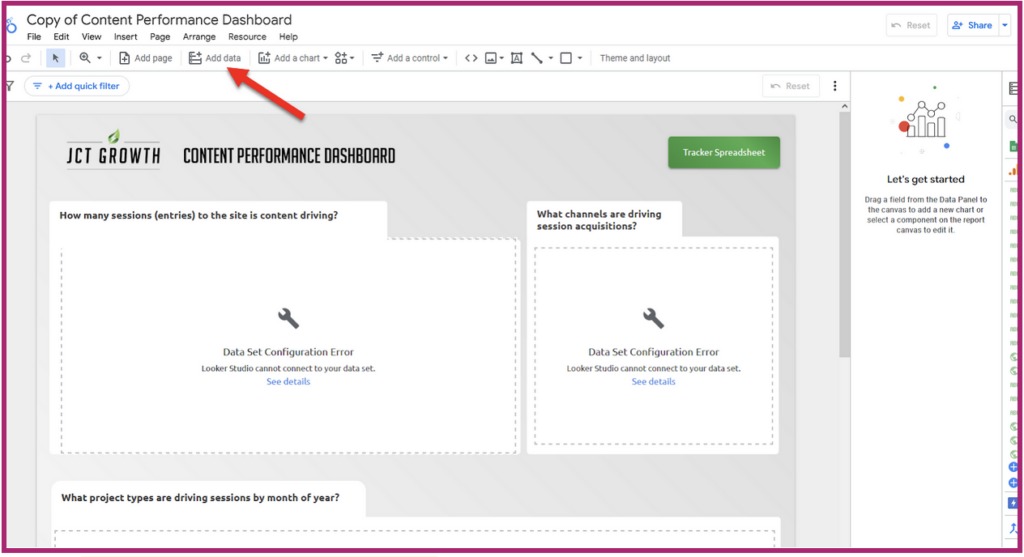
2. GA4 as a data source
- In the top menu, select Resources > Manage added data resources. Then, under the existing resources, select “Add a data source” with a blue plus sign icon next to it.
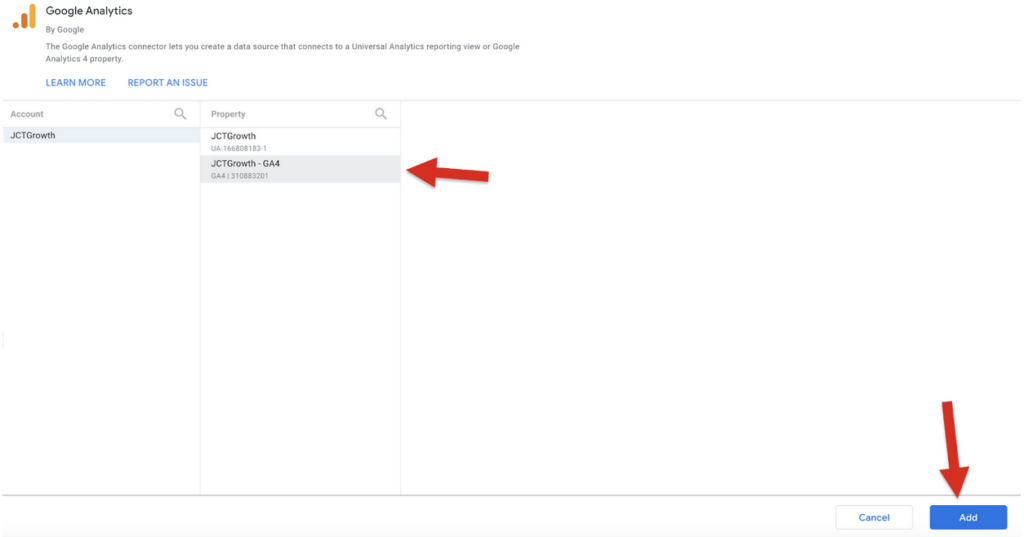
- Select Google Analytics, and then select the appropriate Account and Property (look at your Google Analytics dashboard to find these, if you’re not sure what they are), and click the “Add” button in the bottom right.
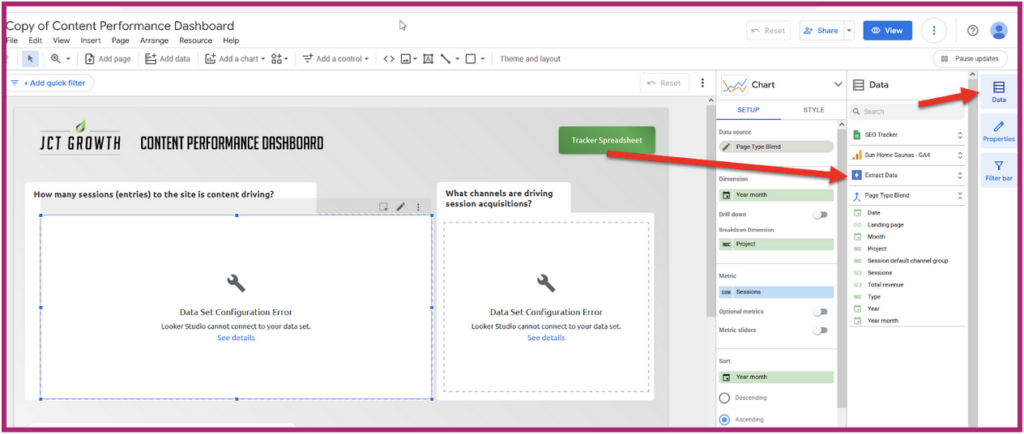
- You should now see the orange three-bars icon with your GA property name in the right-hand Data panel.
3. Set up data extract
A data extract is a good way to pull a limited, more efficient set of data and cut down on load times for your dashboard. Here’s how to set yours up in this template.
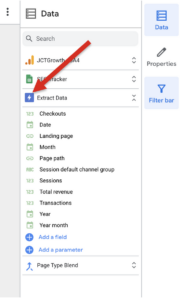
- The copied report should already have a data extract as a data source; you will see it listed in the right-hand Data panel. Hover over the blue lightning bolt icon on the Extract Data line and select “Edit data source.”
- Select the “Select a data source” dropdown. Your GA property should be listed there; select it.
- Once you select your GA property, the dimensions and metrics of the data extract should populate. Adjust the date range as desired.
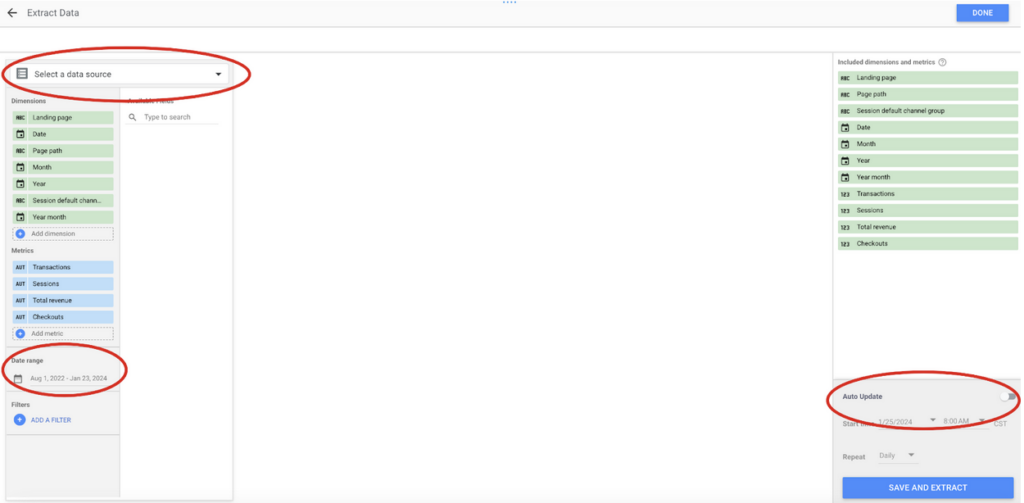
- To the right, you’ll see the same list of metrics and dimensions. Underneath, make sure to toggle the Auto Update switch to On, and make sure it’s set to Repeat Daily. Then, click Save and Extract, and then Done.
- If there’s a repeated error creating the extract or it appears to be timing out the same way after multiple tries, the file may be too large.
Here are a few ways to troubleshoot:
- Try removing the “Date” dimension.
- Try removing the “Checkouts” and/or “Transactions” metrics.
- Finally, as a last resort, try making the date range smaller.
4. Copy and fill out SEO Tracker spreadsheet; add to data sources
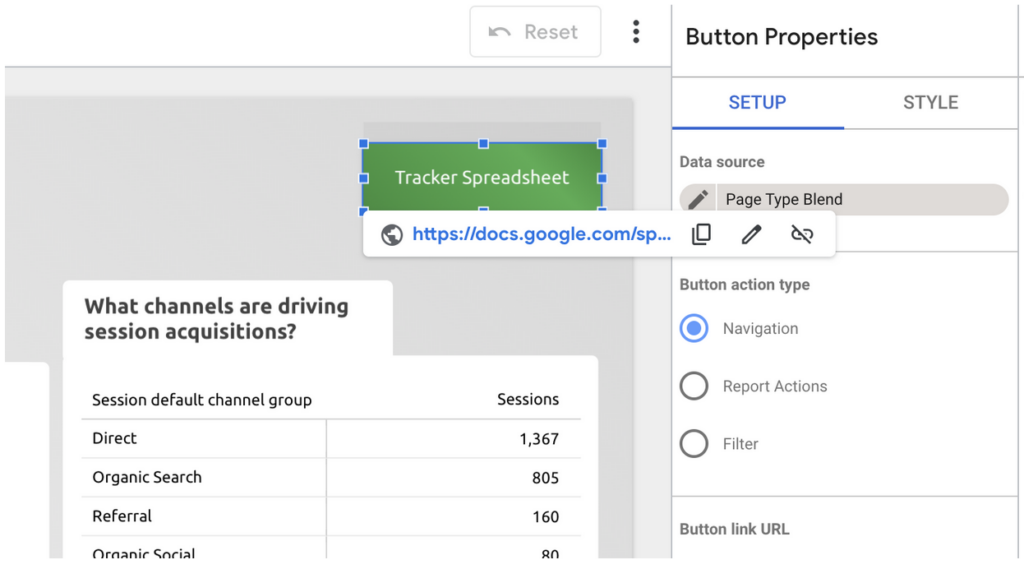
- Click on the green “Tracker Spreadsheet” button.
- Right click on the Google Docs URL and open it in a new tab.
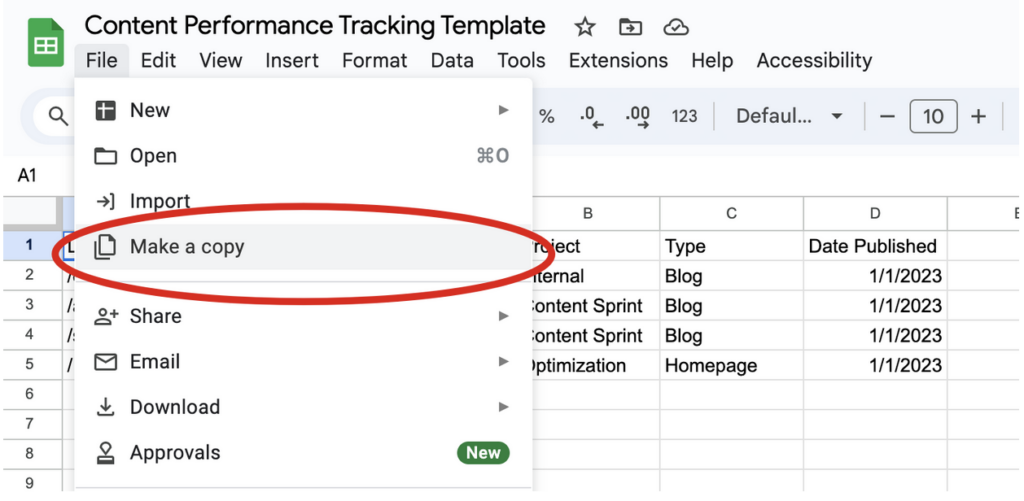
- Select File > Make a copy.
- Name the copied spreadsheet something like “[Your Business Name] Content Performance Tracker.”
- Select Make A Copy, and close out the template tab.
- Under the Landing Page column of your new sheet, list any URL slugs that have been a part of SEO or marketing efforts whose performance you want to track. Be sure to format them like they show up in your GA4 reports. Most of the time, that will be like in the example (just the slug), so you will need to either edit your list, or create a new column with a formula that trims full URLs to just the slug (if you do this, make sure to name it something descriptive you will recognize in Looker Studio, like “Landing Page Slug”).
- Categorize each landing page by Project. These project names can be anything you want—just make sure to be intentional when designating them, so that the categories are meaningful when charted out.
- Categorize each landing page by Page Type. Again, this can be anything you want, but it’s easiest to stick to simple labels like Blog, Location, etc.
- Optional: Include the day each page was published.
- Back in Looker Studio, in the top menu, select Resources > Manage added data resources. Hover over “SEO Tracker” and select Edit.
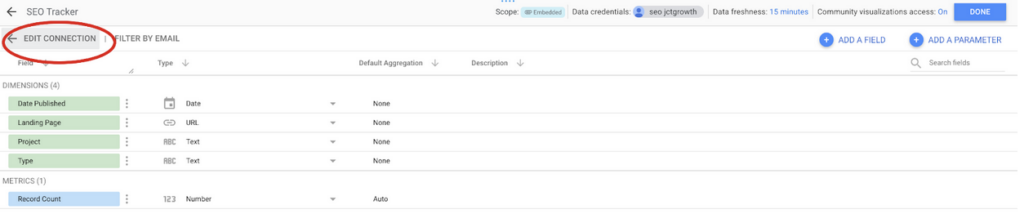
- Select “Edit Connection.”
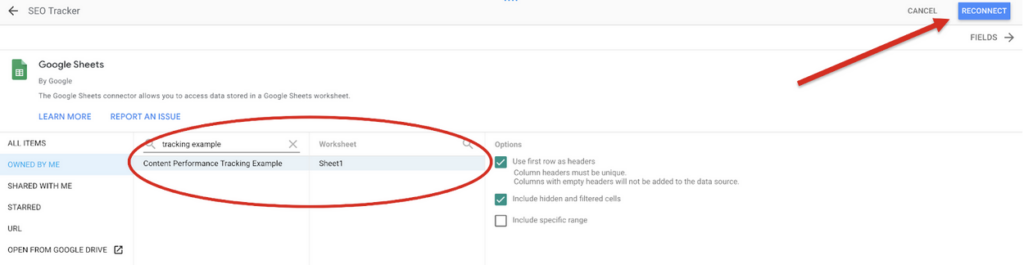
- Search for the name of your new Tracker spreadsheet and select it, and then select Sheet 1 under Worksheet. Then, select the blue “Reconnect” button in the upper right corner.
- It will prompt you to “Apply connection changes” – select “Apply,” and then select “Done,” and then select “Close.”
5. Create Page Type Blend
The only reason this will need to be edited is if you added a Landing Page field on the Tracker sheet. Otherwise, just open up the data source to make sure it’s working and save it as is.
- On the Data Sources module, hover over the icon on Page Type Blend and select “Edit data source.”
- If you didn’t add a column to the Tracker sheet, no changes should be needed. If there don’t appear to be any errors, you can close out.
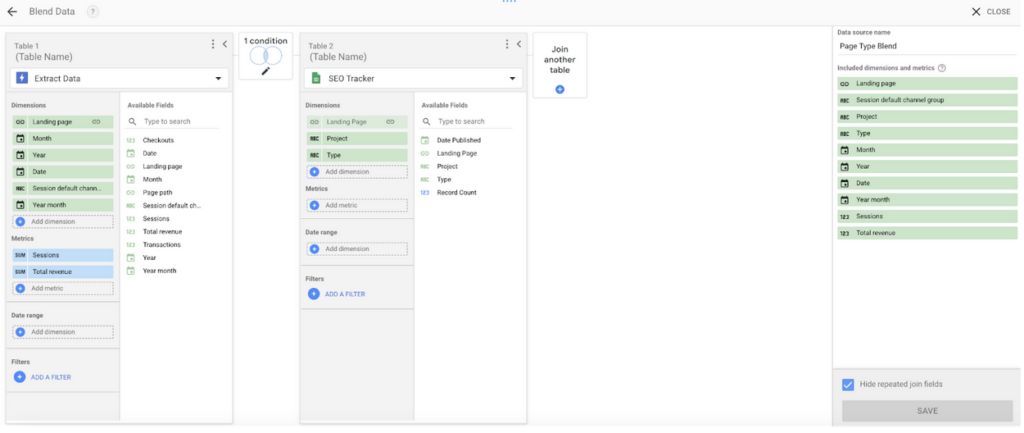
If you did add a column to the Tracker sheet, make sure that is the dimension that’s configured in the data join.
- Under the Table 2/SEO Tracker part of the data blend view, drag the new dimension (e.g., Landing Page Slug) into the Add Dimension box.
- Click on the middle box with intersecting circles that says “1 Condition” to edit the join.
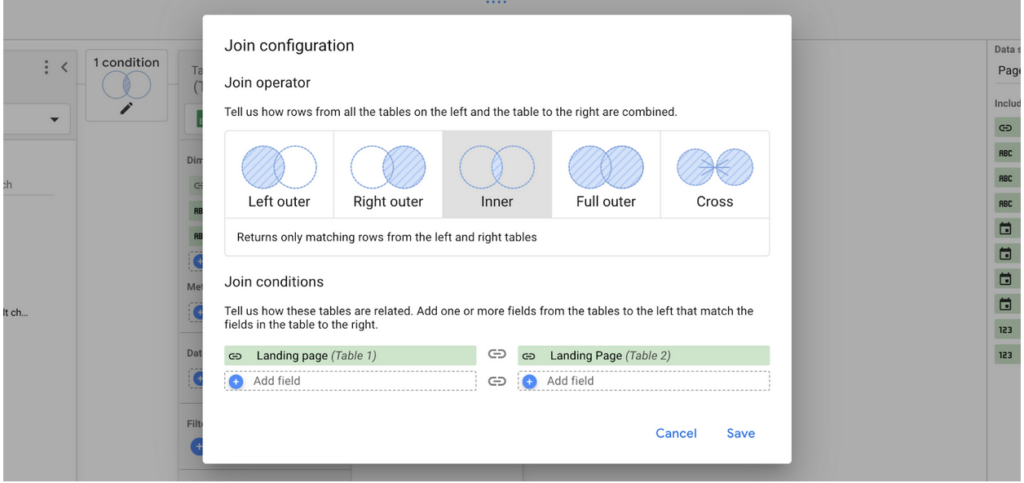
- Click on “Landing Page (Table 2)” and then select “Landing Page Slug” from the drop-down. Click Save.
- In the bottom right corner, click the blue Save button, and then close out.
Pro tip: duplicate this dashboard to a new page and substitute Revenue for all the Sessions metrics on the charts and tables to see the same analysis format for your content’s revenue data.
Now you should be able to see sessions trends for your content by project, channel, and landing page. Follow along for more analytics tools and tips—and don’t hesitate to get in contact with any further questions.

